The Real Issue With Excel
It has been over a week since we discovered that Carmen Reinhart and Kenneth Rogoff made some unusual modeling choices and an error in key calculations in their seminal paper Growth in a Time of Debt.
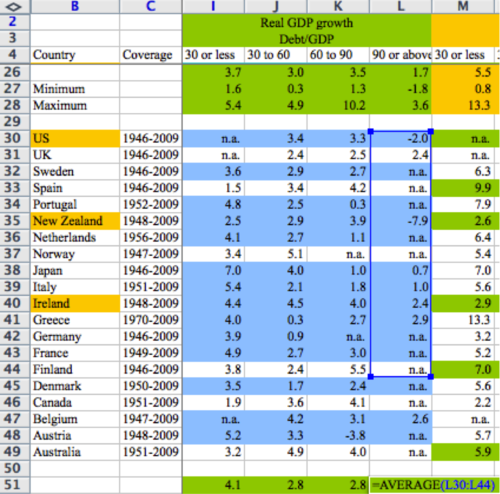
So far, Microsoft Excel has taken a lot of the criticism, with the damning image above used to prove the point. The press has had no problem coming up with other examples of Excel errors resulting in serious costs. Though I do think Ars Technica takes the cake with this image:

I’ve spent plenty of time working on financial models in Excel. In fact, I helped write a book about it. And yes, before you ask, there are (a small number of) errors in the book. My co-author keeps a list of errata for all of his books accessible online, so feel free to check it out and make fun.
However, I now work primarily in R and Python, using each both accounting/forecasting purposes (as well as a bunch of other things, of course). I’ve even worked with SAS on one painful occasion. So I have at least a little perspective to opine on Excel and alternatives.
First, let me say that Excel, as a piece of software, is not the culprit here. My nerd cred be damned, finding the average of a small data set like this is as appropriate a use for Excel as you’re going to find, especially where the data may be updated asynchronously from multiple different sources by hand, and new rows may need to be added piecemeal. Plus, it’s not like other approaches to data work are error-free. Excel has parts that I hate (type errors, propagating rounding, MERGED CELLS… the horror…) but mis-identifying your sum ranges is more sloppiness than anything.
I do appreciate Cathy O’Neil’s commentary on the situation, especially her call that this information should be openly available. And I think that’s a reasonable in an academic setting. Much like Paul Graham’s view that death is the default for startups, I think errors are the default for analysis. It takes a fair bit of effort to make sure that analysis is done right, and generally the best way to do that is to have lots of eyes on the process. And Excel’s biggest drawback is that it doesn’t make it easy for non-authors to see the process.
That is the real difference between Excel and programmatic approaches to analysis. Visually, Excel is what I would call ‘state-oriented’ (I’m sure a case can be made that I’m using ‘state’ incorrectly in a CS sense, but bear with me). Look at the spreadsheet above: only by clicking on the cell do you actually see what operations are being performed. Mostly, you see data. Compare this to what’s on my screen if I did a similar analysis in R:
myData <- read.csv(file=oddly_weighted_GDP_growth_numbers.csv)
output <- mean(myData$90.or.above)
print(output)
Is this cleaner? Yes. Can I see the calculations? Sure! But what do I know about the data here? What’s in front of me most of the time is my code. I would call this ‘function-oriented’ (even though my pseudo-code isn’t ‘functional’ in the least). I certainly can view the state of the data in R, just like I can see the functionality in Excel by opening the editor or clicking on a cell, but that’s not playing to each approach’s strength.
I try to be conscious of this difference when I’m working on analysis projects. In general, the less good I feel about my data, the more likely I am to spend time in Excel. I feel closer to the numbers in that program. On the other hand, if I am more concerned about the steps I’m taking in the analysis, I’ll use R or Python to iterate through different types of analysis and evaluate what’s working and where my errors are.