
My 10 Favorite Pieces of Data (and Management) Content of 2022
Just like in 2021, I’ve sent over 30 newsletters in 2022, which together include hundreds of links to things that interested me at different points of the year. This is a quick summary of the things that stand out in my mind as favorites, now that the year is almost over.

The Finding of Moses Jacopo Tintoretto, Metropolitan Museum, Yep, I’m sticking with Moses this year.
Just like in 2021, I’ve sent over 30 newsletters in 2022, which together include hundreds of links to things that interested me at different points of the year. This is a quick summary of the things that stand out in my mind as favorites, now that the year is almost over.
To be clear, ‘favorite’ doesn’t mean that I agreed with everything in any post or video: many of these have aspects that I don’t understand, or strongly disagree with. But they have stuck with me and influenced my thinking. I hope that by highlighting them here, I’ll be able to find them more easily in 2030 when I’m thinking about what influenced me over the coming decade.
I also feel fortunate to be able to take this opportunity to reflect on the last year and what I’ve learned. I find that I’m able to identify patterns only when I take a step back. Last year, I was surprised at how much of my newsletter was devoted to management topics.
This year, when I look at my favorites, I notice a faint weighting towards questions of discovery, as opposed to management or data infrastructure concerns. How do we find things we’re looking for in a sea of information? How do we detect anomalies, or estimate missing values?
These posts are in chronological order (of when I sent them), not ranked, and some were new to me in 2022, but were written in previous years. Without further ado:
False Discovery in A/B Testing (Ron Berman, NYC Data #257).
I found this paper through one of the authors’ tweets. The paper analyzes over 2,700 online A/B tests that were run on Optimizely, and set some benchmarks for the likelihood that a tested feature would have no or minimal effect (about 70%), and the likelihood of a false positive given that class rating (it’s a lot higher than 5%, not-intuitively). I don’t know how well Optimizely tests would generalize to any particular team’s set of changes, but I’ve used the rule-of-thumb that about 2/3rds of changes don’t have positive impacts for a bit, so this definitely passes the smell test for me.
Imputing Missing Values for Categorical Attributes, at Scale (AI@Compass, NYC Data #258)
Very technical piece about a problem I’ve run across a bunch, and one of the few pieces I’ve seen with practical guidance about improving data quality when you have lots of missing or inconsistently named values. I’d only attempt this in very high-potential-value situations, since the amount of work to set this up seems pretty intensive (and the storage requirements are massive) but I can imagine situations where this would be very valuable.
The Decider App (Nobl.io, NYC Data #260)
This came up at work, and touched on something that I feel like I’ve struggled with as a manager: when should I reach consensus with my team, when should I dictate what we’re doing, and when should we put off making a decision at all. Before reading this I didn’t have any framework to think about which approach made sense in which context, other than some level of frustration when we couldn’t come to a decision, or concern about the impact of overruling (very capable) members of my team.
I’ve consulted this framework a few times over the last year, just as a gut check when I feel unsure of myself. Like all frameworks it isn’t infallible, but it’s given me a good starting point to think about how I make decisions as a manager, and how we do as a team.
You Must Try, and then You Must Ask (Matt Ringel, NYC Data #263)
Once or twice a year, I read something that has been online for many years and immediately say to myself ‘Oh man, where has this post been hiding?!’ Written in 2013, this post is a perfect distillation of how to work on a complex problem and how to effectively ask for help.
At work, we’re in the middle of reviews, and one question that comes up a lot is ‘Autonomy’. When we talk about it in a career growth context, usually we think of more autonomy as a good thing, but we don’t want people getting stuck on problems that have already been solved. This is a great piece for setting expectations around what productive autonomy looks like, especially for technical people relatively early in their careers
Hundreds of AI tools have been built to catch covid. None of them helped. (Will Douglas Heaven NYC Data #266)
We will (rightly) remember 2022 as a pivotal year in the productization of Artificial Intelligence. This summer’s explosion in the availability and power of novel image generation tools and the bombshell of ChatGPT (less than 30 days before when I’m writing this!) really feel like some sort of new chapter has been opened with this technology.
Maybe it’s my grumpy or skeptical nature, but I think it’s still worthwhile to recognize that there are also truly disappointing shortcomings in how we’re able to use data to improve our world. Covid certainly exposed these: never mind AI, basic forecasting models were, famously, all over the place. The glass half-full view might be that even in a world with phenomenal data products coming out seemingly every week, there’s still room to leave your mark.
PLUTO in 5 acts (Amanda Doyle, NYC Data #272)
I have a soft-spot for the PLUTO dataset (which covers all NYC tax lots); I used it when I taught Data Visualization at CUNY years ago. The author, who works at NYC’s Department of City Planning, takes us through the whole modernization & publishing pipeline.
I appreciate seeing how the sausage is made for these big, important datasets. The codebase (which is on GitHub) has almost a thousand commits, to give a sense of the complexity and work that went into this.
Predicting consumers’ choices in the age of the internet, AI, and almost perfect tracking (David Gal, NYC Data #277)
I saw this on Andrew Gelman’s blog, and it was the item on this list that had the biggest impact on how I thought about my work this year.
The paper itself is a bit on the dry side, but the central takeaway is worth repeating: “[P]rediction has become harder due to the increasing influence of just-in-time information (user reviews, online recommendations, new options, etc.) at the point of decision that can neither be measured nor anticipated ex ante.”
As one of my colleagues says: data often can tell us the ‘what’, but not the ‘why’. This piece inspired me to spend less time looking at the internal data that we’re able to generate further down the funnel, and spend a little more time thinking about the competitive landscape and the data that could help my employer understand these decision points.
Features are not just for Data Scientists (Josh Berry, NYC Data #280)
An entertaining story about ‘Data Democratization’ and what it actually feels like in practice (not all good!). My experience working with Data Scientists and Data Analysts has been that they are often very conflicted about other people depending on ‘their’ data. Yes, data professionals want to have an impact on organizations, but they don’t have a great sense of the failure modes of their data, and sometimes get nervous when they think that someone will actually use their data to make a decision (George Box quote, etc). The author’s conversion to seeing the value of making his data available broadly, even if it will slow down his team, is something that resonates deeply with me.
Building Airbnb Categories with ML and Human-in-the-Loop (Airbnb, NYC Data #286)
My favorite data feature of the year: Airbnb classified their inventory to give would-be vacationers a chance to see listings by ‘category’ instead of by destination, helping them discover new locations to visit and helping Airbnb spread demand across a broader supply of units.
The piece was also great, talking about all the work that went into categorization. And it’s only the first of 3: I’m looking forward to the next two!
Data Systems Tend Towards Production (Ian Macomber, NYC Data #287)
Similar to the post ‘Features are not just for Data Scientists’ that I previously mentioned, this is a case study in what happens to data systems over time, as different consumers inside the organization discover them. The author does a great job of identifying trends and giving clear suggestions about how to get the most value out of these systems.
The final warning in this piece, that ‘At some point, your data products will break the production application’, and the recommendation that goes with it, are great things to keep in mind, and to help overcome the fear of ‘messing things up’.
And of course, I can’t finish up without some honorable mentions:
Why skyscrapers are so short (Brian Potter, NYC Data #260)
What’s the most New York thing that’s ever happened to you? (Dan Saltzstein, NYC Data #261)
Bayesian Rock Climbing Rankings (Ethan Rosenthal, NYC Data #268)
What if every dashboard self destructed (Randy Au, NYC Data #281)
Measuring Search Relevance, Part 2: nDCG Deep Dive (Audrey Lorberfeld, NYC Data #282)
Some notes on the Stable Diffusion safety filter (Vicki Boykis, NYC Data #286)
Thanks so much for reading, and for being a newsletter subscriber (if you are one: if not, I’m amazed you made it this far and you can subscribe here). Happy Holidays, and best wishes to you and yours in 2023!

My 10 Favorite Posts on Data (and Management) of 2021
I’ve sent nearly 40 newsletters in 2021, which together include hundreds of links to things that interested me at different points of the year. This is a quick summary of the things that stand out in my mind as favorites, now that the year is almost over.
The first listicle. Moses Receiving the Tablets of the Law on Mount Sinai. Pietro Santi Bartoli, Metropolitan Museum
I’ve sent nearly 40 newsletters in 2021, which together include hundreds of links to things that interested me at different points of the year. This is a quick summary of the things that stand out in my mind as favorites, now that the year is almost over.
To be possibly pedantic, ‘favorite’ doesn’t mean that I agreed with everything in any post or video: many of these have aspects that I don’t understand, or strongly disagree with. But they have stuck with me and influenced my thinking. I hope that by highlighting them here, I’ll be able to find them more easily in 2030 when I’m thinking about what influenced me over the coming decade.
While the newsletter and many of these posts are on the topic of ‘data’, I spend more time thinking about management and organizational design in my current role. That shifting of interests is definitely reflected here.
These posts are in chronological order, not ranked.
Designing Engineering Organizations (Jacob Kaplan-Moss, January 8th)
In my first newsletter of the year, I linked to a piece that made me feel really good about some of the organizational changes that my team had just made a few months before. Here’s the punchline to the piece:
[T]he most effective teams are stable, multi-disciplinary, aligned to product delivery.
A year on, I have somewhat mixed feelings here. I really enjoy Kaplan-Moss’s writing, especially how tight the focus of his pieces are. But I took the time to read Team Topologies last year as well, and I think I lean towards Skelton & Pais’s view of organizational structure.
One thing that has annoyed me about engineering organizational writing is that the authors (in general) seem much more concerned about teams being too big than being too small. Maybe it’s just a sign of the times and competitive job market, but I worry much more about silos, burnout from constant on-calls, and overlapping responsibilities between teams than I worry about having ‘too many people [to put on a deliverable] to form a single team’. Sounds like a nice problem to have!
Let Them Log Scale (Jessica Hullman, February 12th)
Compared to previous years, there were relatively few great posts about data visualization that I saw in 2021 (either relating to theory or practice). My favorite link out of this bunch was Hullman’s, by a wide margin. I used to teach data visualization, and ‘what are the measurable outcomes of good/bad visualizations’ has always been a tricky one for me to internalize.
Hullman links to a blog post about a study (yes, tertiary source) about the impact of using log scales during COVID-19 (when everyone was looking at graphs every day).
[W]hen people are exposed to a logarithmic scale they have a less accurate understanding of how the pandemic unfolded until now, make less accurate predictions on its future, and have different policy preferences than when they are exposed to a linear scale.
This hasn’t come up in life yet, but I’m keeping it handy next time some fellow viz nerd tells me that a log scale is more appropriate for a presentation!
Taking Criticism While Privileged (Pamela Oliver, April 16)
This piece (and the full essay it’s adapted from) was, without a doubt, the piece of writing I had the strongest emotional reaction to this year. I know it’s a bit older, but I don’t think I could put together a list of 2021 favorites without including it. Written for academia, I think it’s pertinent for anyone who manages and strives to build a culture that values open dialogue with their team and throughout their company.
How should you respond when a student says something you said or did was domineering, insensitive, racist or sexist? What if you think that criticism is unfair or inappropriate? What if you think the critic has a good point and you feel bad about it?
This piece resonated with me in a way the more popular texts about the daily application of privilege and have not. Since reading this, I think I’ve become more appreciative and understanding of the things I can’t change and the agreements I can’t broker, and surprisingly I believe it has made me more effective and better to work with.
Churn is Hard (Randy Au, April 16)
I’ve really enjoyed Randy’s Substack this year: one of my go-tos when I’m looking for a NYC-area post and I haven’t seen anything over the course of the week.
There’s no silver bullets, just grind
This post (and one of the twitter threads it references) is terrific in talking about the crux of big conceptual problems like churn, which is identifying the group of people you want to understand better. Your userbase is likely to be deeply heterogeneous, and even products with relatively simple interfaces might support many different usage patterns. So understanding patterns of user action requires a lot of work to segment out all the users who interact with your product in a different way.
Finding Structure in Users’ Evolving Listening Preferences (Passino et al, April 30)
I’ve often wondered how we can understand ‘growing up’ online. So much of the time, when we talk about people interacting with our websites or products, we think of them as some sort of fixed ‘persona’, while in our regular lives we experience changing interests and constraints all the time.
[T]o better serve users in the long run we need to understand how their long-term preferences evolve over time.
This piece (based on the paper) tackles this via transition matrices. Since music comes with a lot of cultural context, even without a real understanding of how Spotify works I can see some patterns that seem intuitive to me (soul -> motown -> rock) and some that don’t (house -> country?). I do wish the paper had covered a time period longer than 6 months, though.
There was also some fun trivia in the piece. The authors used 4,430 musical genres! (you can see them here: they’re now up to 5,701 as I write this).
Potemkin Data Science (Michael Correll, June 14)
I had a conversation with a friend who was shaken to the core reading this piece. The feeling that the work we do doesn’t matter is a deeply disquieting thought. Data Science certainly doesn’t have a monopoly on this, but I know many people who work in analytical roles worry about whether or not the people who make decisions are open to changing their minds based on ‘what the numbers say’.
[A] lot of the dashboards we were seeing appeared to be for “decision-laundering:” justifying stuff that had already been decided at levels above us.
I really enjoy Correll’s writing here, but my biggest gripe is the passivity of the data actors in his scenarios. The lack of buy-in or support for making decisions comes from two-dimensional executives who come across as either cynics or dilettantes. Where is the Data Science Manager or Executive in this, understanding the constraints of their partners and identifying the right ways for the teams to work together? Where is the trust-building and the attempt to measure the utility of these data insights?
Building a Data Team at a Mid-Stage Startup: A Short Story (Erik Bernhardsson, July 12)
I have really enjoyed Bernhardsson’s thought experiments, and this is my favorite of the set he’s written over the last few years. People who work in analytical roles talk a lot about organizational structure, but this is the first piece I’d seen that really dealt with the experience of building out a team, and the tactical constraints and decision-making that go into it.
The backdrop is: you have been brought in to grow a tiny data team (~4 people) at a mid-stage startup (~$10M annual revenue), although this story could take place at many different types of companies.
For me, a lot of the story rang true, and parts felt eerily familiar. I’ve seen the tension between ‘I want to work on the cool stuff’ and ‘I need someone to do that stuff that that business needs’ can be really stark if expectations for roles are not set up correctly. I’ve also seen the road to data products appear after digging out from deep organizational and technical debt.
The pattern of ‘Data Team as expensive QA’ comes up in this piece; I see this as the most gratifying way that data teams have added value to product org. Being able to say ‘you have this issue in pattern/flow you aren’t testing well’, and seeing the numbers respond immediately when the issue is fixed can feel like magic.
The Untold Story of SQLite (Adam Gordon Bell & Richard Hipp July 12)
I love love loved this piece! From the genesis of the idea (on a battleship!) to early views of the smartphone market, to the testing coverage work, (I had actually read about the project's code coverage before, but it's breathtaking) it's all just mind-blowing.
Adam: 100,000 distinct test cases, and then they’re parametrized, so then, how many …
Richard: Yes, so we’ll do billions of tests.
Adam: Oh, wow.
Richard: Yeah. We have a check list and we will run tests for at least three days prior to a release.
I’m partial to hearing from old-timers about how the critical infrastructure we rely on every day is built and maintained. This was the best thing from that genre I’ve read in a bit.
Richard Hipp does come across as a bit… eccentric here at times (your own VCS? Your own mail server?) but he’s funny and thoughtful, and it makes for a great conversation and transcript.
Pseudo-R²: A Metric for Quantifying Interestingness (David Robinson, September 2)
My favorite quantitative piece this year introduced me to McFadden’s pseudo-R², which I wasn’t familiar with before. The idea of using this as an automated sweep through different potential cuts of data seems like it could be really helpful with a first pass of ‘data-mining’ large datasets and pointing to areas that deserve further, manual investigation.
Pseudo-R² thus balances the variation in groups with the composition: it rewards groupings where there are common categories that have unusually high or low success rates.
Robinson’s writing on the topic is very clear, despite the technical subject matter, and the graphs and examples are all really well conceived. Overall, I came away from this really impressed.
The Missing Analytics Executive (Benn Stancil, December 10)
Out of all the posts that I mentioned in my newsletter this year, this one got the most responses from my friends and peers.
Benn really nailed the experience of running a team and its discontents. Whether you’re in ‘the room where it happens’ or not, most of us haven’t figured out how to make our work consequential to our organizations the way Engineering & Marketing are.
Without the gravity of a large organization underneath them, these data executives play bit parts, pushed to the back of the board deck and relegated to the always-too-high G&A budget, an administrative asterisk next to the departments that are seen as making real products or real money.
It’s not clear to me this is a big problem, for what it’s worth. Sure, it’s a problem for me, and the people Benn is talking about, granted. But I don’t hear a lot of HR or security leaders gnashing teeth and rending cloth because their teams aren’t ‘First Class Citizens’ (a concept I get asked about constantly and dislike immensely) at their company. There’s a whiff of diva (from the theoretical leader, not from the author) in the construction of the problem, to be candid. Data is important, really important, but a lot of things are really important.
Regardless, the question of ‘how to best serve an executive team with analytical support’ is a great one, and I’m glad Benn posed it. I understand the idea of the 'very senior IC in the leadership room'. I talked with the person I know who most closely fit that mold, and they had mixed feelings about this but couldn’t really articulate a better idea, and I think that’s where I am at the moment as well.
So that’s it! Here are some honorable mentions:
The Hard Lessons of Modeling the Coronavirus Pandemic (February 19)
On power markets, snow storms, and $16,000 power bills (February 26)
Democracy's Data Infrastructure (April 2)
How We Manage New York Times Readers’ Data Privacy (May 21)
Finding Clusters of NYPD Officers in CCRB Complaint Data (July 6)
Zillow, Prophet, Time Series, & Prices (November 8)
Estimating the Geographic Area of a Real Estate Agent (November 22)
Also, here are my favorite bits of trivia that I uncovered this year.
Your body burns around 1/250th of a calorie warming up the frozen air in each breath that you take (January 22)
This study on car seats as contraception (March 12):
We estimate that [car seat] laws prevented only 57 car crash fatalities of children nationwide in 2017. Simultaneously, they led to a permanent reduction of approximately 8,000 births in the same year,
The names of Donald Duck's nephews in various European languages (March 19)
The Governor of Utah offered a mea culpa for the state incorrectly calculating its vaccination stats. Counting stuff remains surprisingly difficult! (July 19)
And this is the dumbest game I wasted hours on: Iceberger (February 26)
Thanks so much for reading, and for being a newsletter subscriber (if you are one: if not, I’m amazed you made it this far and you can subscribe here). Happy Holidays, and best wishes to you and yours in 2022.

Internal Transfers: The Best Way to Build Your Data Team and Alienate People
While any organization would benefit from shared rules about transfers, data teams are uncommonly likely to need them

Great Departure and Temptation of the Buddha, 3rd Century, Metropolitan Museum
Several times a year, I am approached by (or hear about) employees who want to transfer between teams.
This is the most chaotic, uncertain situation that I routinely find myself in as a manager. The stakes are high; I’ve seen people leave jobs that they didn’t dislike because transfer issues poisoned relationships, and I’ve seen employees who were ready to leave the company find roles they loved and stayed in for years. There’s also no clear playbook for how these things go, and even when there is, I’ve seen emotional leaders override guidelines or exploit rules to prevent transfers from going ahead.
After having a number of conversations related to transfers, I finally decided to write down my feelings about how to make them less painful. Throughout this piece, I’ll refer to the potential transfer as an Individual Contributor (IC) to differentiate them from their current manager and the hiring manager (of the team they’re looking to move too).
While some of the thoughts here are specific to data teams (because this is the world I work in and know), I think a lot of this is applicable to technical teams generally, and maybe beyond that.
Why are transfers so common to & between data teams?
While any organization would benefit from shared rules about transfers, data teams (specifically, teams that primarily are responsible for manipulating, reporting, and drawing insights from company data) are uncommonly likely to need them, for the following reasons:
Long ramp up times
At every company but the newest of startups, I would argue that data teams have the longest ramp-up periods of almost any role.
It’s true that other roles take time to understand: engineering roles with sticky legacy systems are not easy, nor are HR or Enterprise Customer Success roles. For all these roles (for all roles, really), there’s a lot of history & context to understand.
But data takes a long time to ramp up on because in addition to having to get ramped up on your own systems and relationships, the company’s history is your product, to a large extent. Every dip in a chart or change in a pattern can generate questions, and you’re likely to get asked about them. Your confidence in these numbers will be evaluated, and you can’t serve the organization effectively without knowing the answers. And knowing the answers takes time.
Internal transfers already know a lot of that history. They know about the major releases and outages. They know how the business responded to the pandemic, and when marketing campaigns went out. Maybe they even know about that bug from 2 years ago that impacted reported landings, or changed how users were deduplicated.
In fact, they likely know a bunch of stuff that the team they are transferring to, doesn’t. This makes them exceptionally valuable for a data team. In particular, I’ve seen transfers from Marketing and Ad Ops have huge positive impacts on data teams by bringing their understanding of company history with different vendors and strategies that were unknown to data scientists and engineers. Knowledge of the current vendors would be valuable in a lot of places, but knowledge of the historical ones really matters in the data world.
Lots of potential candidates on different teams
If you were to think about the last company you worked at, and I asked you to list all the people (or all the teams) who consider data manipulation or analysis part of their job, how many people/teams would you come up with?
Explicit Data teams, of course. Someone in Finance, certainly. Likely Marketing. Maybe some other operations team. If you’re at a bigger company, probably someone in HR and someone in the sales org. This offers a lot of fertile ground for transfers, for a couple reasons.
The first is that it’s difficult for analysts to up-level their skills when they report to a domain expert. Certainly, they’ll be able to learn about their domain, and that’s really valuable, especially if they want to grow into that domain (this is most common in Product, where people aspire to become PMs, but it happens elsewhere too). Switching to data-oriented teams is the other path for them: the opportunity to double-down on analytical skills.
The other, subtler point is that, unless teams are really intentional, there’s often not a ton of room for career advancement for analysts in different functional areas beyond being a first level manager. Sure, managers (in my experience) value the work their analysts do, and are more than happy to promote them, pay them more, and help them hire a team. That’s very good stuff, and probably leaves room for a whole decade of career progress for the first successful analyst in. But do those analysts have room to become VPs, or decision-makers for the business? And what about the later analysts who work for someone who already runs the analytics team?
So what’s the problem?
Ok! So there are a lot of people who might be interested in transferring to your data team, and you will get a ton of value out of it! So why is this so hard?
Suspicion of other teams
Steve Yegge famously called out that Data Science teams seem to dislike each other. Unfortunately, I think that’s often true! As a group, we tend to cherish the interdisciplinary nature of our work, but the flip side is that we aren’t always great at creating bright lines about ‘who does what’.
Interesting problems often have several teams who plausibly could claim them, and so without good communication and coordination, it’s common for teams to feel like they’re competing (eg: who owns your customer LTV estimates? Marketing or Product? Data Scientists or Analysts?).
In the best situations, these are opportunities to collaborate across teams. In the worst, they are grist for paranoia and building up a collection of gripes. ‘Land grabs’ and refusal to share data between teams aren’t terribly uncommon in my experience.
In addition to these ‘horizontal’ issues, there are ‘vertical’ issues. Downstream teams (usually analysts) might have tighter relationships with stakeholders, and your more technical teams might feel ‘cut-off’ from decision-makers. On the other hand, those same downstream teams feel like they don’t have the skills or access to ingest & transform data, and worry that their requests for data access and bug fixes are deprioritized behind whatever shiny new thing the data scientists and data engineers are playing with.
Add in the possibility that teams might be perceived as recruiting across these boundaries, and you have a really volatile interpersonal situation on your hands.
Indecisive ICs
I love working with data professionals, but I have to concede that as a group, we are not the most decisive. We’re analysers. We think things over. We keep an open mind.
When you’re talking about making big changes at work, this indecisiveness can be a killer. Transfers can linger for months, starting rumors about why an Analyst or Data Scientist is switching teams (or not).
Relatedly, people who are used to gathering information will often talk to a lot of different people on different teams, trying to understand what different roles look like. That’s good! They should be making informed decisions! But when an analyst talks to three other teams, and then chooses one of them, it doesn’t feel great to the others, who might feel spurned or judged.
Lack of an open process that’s perceived as fair
This is not unique to data teams, but the standards on internal transfers are all over the place. I’ve seen teams with incredibly rigorous, selective interview processes for new employees just ‘wave in’ internal transfers based on personal relationships or internal reputation.
Couple this with the fact that it’s not obvious that individual teams are hiring, or that there are open roles to apply for, and it can feel like certain opportunities are only open to those who have relationships with ‘the right people’. For others on the outside of these relationships, this process can feel a lot like an “old boys’ club”.
Managers can expect to know about all of the people who ask for a new role, but not all those people who would apply for a new role if they knew it was open or a possibility. If one group of people is more comfortable with promoting themselves than another, it’s going to lead to uneven outcomes and bias.
This pattern is deeply corrosive to relationships and team culture. If you’ve ever felt like you were passed over for promotion, or saw someone else get a role that you would have been interested in, you might be having an emotional reaction just reading this. These feelings are deep seated and truly very difficult for people to get past.
How should this work?
I don’t think that there’s ‘just one way’ for transfers to work. Companies operate differently and with different expectations. However, I think there are a few guidelines that make things run a bit more smoothly.
Publish potentially open roles (ideally on a job board)
Posting roles is the single most important thing you can do to improve your internal transfer process. At my current role, we have an internal job board and we aim to post roles there before we consider internal transfers. Some companies won’t have this, but most companies will have an all-hands or at least a company-wide slack room (or similar) where you can advertise a role.
Posting is important to clarify the role, reduce bias in team formation, and to make people feel like they’re on an even playing field.
Posting a role is clarifying because you are writing down responsibilities and expectations. Internal transfers can be overconfident in their knowledge of what life on another team entails. I remember a potential transfer who did not realize that the team they wanted to work with had an ‘on call’ schedule: seeing it spelled out helped the applicant make a more informed decision.
Posting a role reduces bias because it ensures everyone sees the opportunity, and applies. It is almost certain that a manager’s communication pattern embeds biases towards certain teams, personalities, interests, ages, genders and/or ethnicities. These mean that without a posted role, only some of the people at the company who might be qualified for a role are likely to know about it. By posting a role, a manager can decouple their communication patterns from finding the best person for the role.
Even if a manager doesn’t have any bias in their communication, the practice of posting roles gives employees comfort that they’re on an even playing field. The transparency of the process gives the rest of the team confidence that these decisions are made out in the open, and that even if they disagree with decisions and timetables, at least they know that their career advancement isn’t solely dependent on getting 1:1s with the right people.
A practical consideration: transfer as a ‘save’
Sometimes, a talented employee will say that they aren’t happy in their current role, or that they are interested in working for a team that doesn’t have a current opening. There are many variations on this, but the most common situations I’ve seen are:
Burnt out managers looking to move to senior IC roles
ICs looking to escape teams in difficult situations
To be candid, I’m very conflicted about these situations. They generally put managers in a tough situation: is this person valuable enough that I still want them in a new role that I feel is less valuable (and if you think the new role is more valuable, why didn’t you move them before they asked)?
In general, I think helping people be successful (and finding a valuable place at the company for them) trumps most other considerations, so I tend to err on the side of supporting these transfers. I worry about this, though, especially in the case of teams that don’t seem to have a clear path to sustainable success. I find myself drawing these transfers out over many months as we ramp up recruiting and support for the teams that these people are departing.
No direct recruiting
If you manage both teams involved in a potential transfer (ie the current manager and hiring manager both report to you), you can approach an IC and ask them about moving teams. This is a reassignment to move a person into a role you think will add more value to the company, and you, as the manager of the teams, are empowered by the company to make this decision (with the consent of the employee). You should not be shy about this.
In any and every other situation, DO NOT directly recruit people to your team from other teams! There are lots of reasons this is a bad idea!
There is likely a power differential between you and a person you would be recruiting. Some people have a really hard time saying no to authority! You would not believe how far out of hand I have seen this get!
If you do this, you will more or less instantly lose the trust of your peer managers, who will view you with suspicion!
You may be causing your boss a big problem, by recruiting someone away from a role that they think is more important to the organization!
If you think that the company would be substantially better off with a person moving from one team to another, go to their manager and talk about it, and/or to the person who is high enough up that they manage both where the person is now and where they should go. This manager is empowered by the company to make this decision.
Personally, the furthest I will go is to make sure that the role is well publicized to the people I think might be a good fit.
ICs apply or talk to hiring manager first to register interest
Once the role is publicized and an IC decides they are interested, the first step should be for them to speak to the hiring manager on the team they are trying to move to. The hiring manager should be able to give the IC one of three answers within a few days:
Yes, we would love to have you on the team, without any interviewing
No, we don’t think you’re a fit for the role (or it’s already filled)
You are welcome to interview for the role
Those are, effectively, the three answers, with slight variations on timing and other considerations.
I don’t think that the current manager should have much of a say in employee mobility beyond timing (and maybe setting attainable exit criteria in some cases), but maybe in certain situations there’s a need for obtaining a blessing from other people in the organization.
I have seen people suggest that ICs should speak to their current manager first, which I disagree with. Just like most people probably wouldn’t tell a manager if they were looking for a role externally: if it doesn’t work out, you likely damage your relationship with your manager, and your manager is less likely to advocate for you or invest in you if they think you have one foot out the door.
I have heard people clarify that ICs should talk to their current manager if they’re unhappy in their current role, which is true but a different thing.
Should there be any restrictions on ICs transferring?
Generally, I don’t think there should be many restrictions, but there are edge cases:
Minimum time in role: This is the most common restriction: the idea is that new employees don’t add much value when they start in a new role, and it’s a bit unfair to the manager to train them up and then hand them off.
In good standing: Some places require employees to be in good standing before they can transfer.
Critical project: If an employee is working on a very important project, and wants to work on things that are perceived as being less valuable, this is sometimes blocked.
Regulatory restrictions: sometimes people from one part of the organization can’t know what’s happening on another side. This is most common in finance, between research & banking, but I imagine it happens in other places.
I’m sure there are other restrictions as well. None of these are inherently bad policies: it will depend a lot on the company, team, and situation.
When a manager wants their team to switch parts of the organization
One case that seems like a transfer but is not is when a manager wants to move their team to a different part of the organization. This seems like an internal transfer, but it’s not: it’s a bottoms-up reorganization.
The process should have some similarities to an internal transfer (no direct recruiting, the potential transferer approaches the potential new manager first) but this has to go to the executive who is responsible for the whole reporting structure.
Candidly, from the exec’s perspective, this is tricky: moving a team away from a manager significantly changes their job. I’ve seen this happen, but most execs may not be on board with this at all, and probably will only be on board with it if the current manager can be persuaded.
Still, I think it makes sense to go to the exec first, just to see if they’d be supportive if you could get the other manager on-board that it’s the right thing for the company (not just for the person/team that wants to transfer). The exec is presumably going to have to sign off on this anyways, so it’s better to ensure that the support is there before going into the conversation with the manager who might be handing over a team.
Do’s and Don’ts
So that’s a lot. Let’s wrap this up with some simple things to remember.
If you’re the hiring manager
It’s ok to aggressively publicize your roles, but don’t go to specific people and ask them to join your team! Don’t do it! Trust me!
If an internal candidate reaches out to you, keep it to yourself until you know if you want to interview or think it’s plausible you’ll want to hire them! If you need to check with others on your team, treat this as sensitive information and keep the number of people involved to a minimum.
If you do end up accepting someone as a transfer, be generous with the team that’s transferring the person, and expect the transfer to take several weeks. Set a firm, clear end-date where the IC knows that their old manager shouldn’t be asking for additional work from them, but let the IC know that maintaining a strong relationship between teams is a priority.
If you’re the IC
Your primary obligation in this is to yourself: find the role that is best for you, be proactive about reaching out and having discussions with different teams.
I have seen ICs that thought that they should go to HR when they want to transfer teams. They aren’t your first stop (unless you’re trying to transfer into HR)! The hiring manager for the role you want is the right person to talk to. HR is there to help set standards on interviews, timing, and to flag potential issues (like pay & leveling disparities between teams)
Expect this to take a while, probably as long as interviewing externally. You’ll probably save time identifying a team, but the ‘notice’ period will be longer, almost certainly.
Like it or not, if you transfer, you’re going to have to tell your current manager. The idea of saying you don’t want to work on their team anymore, but you still are going to see them regularly at work, might make you feel uncomfortable. Try not to worry about it too much. A good manager is going to be glad that you’re staying at the company. If you’re scared, that’s a knock on the manager.
Your (current) manager may try to ‘keep you’ by asking about why you’re leaving and trying to address your concerns. I think this can potentially be a productive conversation. Hopefully, the reason you’re leaving is because you want to do what the other team is doing: if that’s the case, there’s probably not that much to talk about. If you’re concerned about your career progress, I’d encourage you to talk about it with your manager separately.
If you’re the manager whose IC is leaving
It’s ok to ask the IC why, and to try to address concerns. It’s even ok to ask if they would consider staying if you change a few things. However, it’s easy to panic when someone is leaving, so be careful not to make promises that you can’t follow through on, or even those that you know are not in the best interests of the team.
Above all, don’t take it personally. It’s hard enough for people to find fulfilling roles that are right for them. If they’re staying at the company, honestly, you’ve done fine. Smile, congratulate them, and get to work filling your open role (start by posting on the internal job board)!

Gresham’s Law of Time Management: When to Blow Up a Week
There is a concept in economics called Gresham’s Law, which is usually summarized as ‘Bad Money Drives out Good’.
Hawk Coin of the Emperor Akbar, 1556, Metropolitan Museum
There is a concept in economics called Gresham’s Law, which is usually summarized as ‘Bad Money Drives out Good’.
There’s a full writeup at Wikipedia, but in short: when there are coins that are made of varying amounts of a valuable metal (let’s say silver), but are worth the same amount by a government’s decree, people will rationally spend the coins with the least silver (the ‘bad money’) first, and hoard those with more silver. Over time, the ‘bad money’ dominates the usage of the currency.
Anyways, this is a reasonably well known and remarked-upon phenomenon.
I only recently became aware of ‘Gresham’s Law of Time Management’ a theory about how managers (but, really, anyone who works with other people) spend their time. The best statement I’ve found is here (emphasis added):
This law states that there is a general tendency for programmed activities to overshadow non-programmed activities. Hence, if a series of decisions are to be made, those that are more routine and repetitive will tend to be made before the ones that are unique and require considerable thought.
Different authors identify different patterns related to how this law manifests itself:
‘Doing the work’ instead of managing: because most managers find individual contributor work more familiar and less threatening than managerial work, so they’ll take on lower-leverage work instead of teaching/training someone else to do it.
‘Clearing their desks’ for bigger decisions: managers attempt to do administrative work so they can ‘focus’ on really serious decisions. Unfortunately, the difference between clearing desks and procrastination is usually academic: in my experience, putting a decision last on your list rarely means that it will get the attention it deserves.
Avoiding uncomfortable or anxiety-inducing situations: managers struggle to have difficult conversations with their team-members, or to make decisions that might cause conflict (canceling initiatives, changing management structure, etc). So they put them off.
Having been a manager for a bit now, I have to admit that there’s something here: I’ve certainly been guilty of all three of these things at different points in my career (though if you look closely, the first two are really just examples of the third).
On the other hand, I think treating this as a failing, or implying that programmed activities & decisions are ‘bad’ (which is the connection to Gresham’s Law) is a bit unfair to managers. I can think of 3 reasons why it would be reasonable to focus on ‘routine’ decisions or meetings:
Consistency and Clear Expectations
A huge part of a manager’s mandate (at least how I see my mandate) is setting clear, predictable expectations for the people on their team. Programmed activities and rituals (regular planning meetings, one-on-ones, presentations to executives) are critical to how these expectations are set and fulfilled.
As a manager, I expect people on my team to have flexibility around these milestones, but there’s a limit to how much they should (or will) sacrifice their personal plans for interrupt work and other ‘fire drills’.
Manager Credibility
Presumably, if I’m managing a team, I am the one responsible for the form of many programmed activities that the team works through. If I am canceling them with frequency, what does that say about the value of those meetings?
Hopefully, as a manager I’m regularly assessing the value of different activities I ask the team to spend their time on, and ensuring that the schedule I set makes the team more effective, not less. If I were to find myself regularly canceling something (or thinking that I should be working on something else), maybe the real issue is that this ritual isn’t very valuable.
Regularly cutting meetings (or maybe more accurately minimizing the amount of time and administration needed for the regular operation of the team), seems like a more worthy goal to me than prioritizing interrupt work.
Your Imperfect Knowledge
Finally, the things that seem important and urgent aren’t always as important and urgent as they seem. Disrupting your team comes with real cost, so you need to be pretty confident that work actually is important and urgent before you begin to postpone or cancel other work.
I’ve found that often, a little bit of time and discussion with relevant parties about an issue often leads me to realize a simple solution, or that the problem isn’t as big as I previously thought it was.
I’m sorry to say that I’ve seen lots of companies and managers commit ‘unforced errors’ by rushing to solve a problem without a lot of thought, or without considering their full universe of options. It’s hard to say with any confidence that it’s more common than ‘under-reacting’ to issues, but if I had to guess I’d imagine that errors happen each way with about the same frequency.
While I was writing this: Rands wrote about an adjacent topic, and put it more succinctly: “Don’t confuse pressure with urgency. Don’t confuse importance with urgency”.
Synthesis
So where does this leave managers?
The primary actionable question that got me thinking about this is: when should you blow up your week (yours or someone else’s), canceling or postponing regular decisions & meetings (or heaven forbid, a vacation) to deal with an important issue or emergency?
I would argue this is among the most important tactical level decisions that we make as managers. Blowing up a week (or a sprint, or a deadline, or canceling meetings) can have a galvanizing, focusing effect, and allow people to coordinate together without interruption for extended periods of time. On the other hand, it impacts your credibility and violates expectations that you’ve set for your team and your stakeholders.
Obviously, there are no universal answers here: personalities, company culture, and the domain you work in all matter a great deal.
Self-assessing a bit here, I think I fall on the ‘stick with the program’ side of things, though I’m not at the extreme. I work with people on either side of me on this spectrum.
I think it’s valuable to know where you fall on this scale compared to your colleagues. If people on your team are more inclined to ‘Go into firefighting mode’ than you are, you’ll have to temper discussions of important issues to prevent them from going off track. On the other hand, teammates who want to stick with the program more are going to need explicit direction that you’re expecting immediate action from them when talking about something emergent.
But more than anything, I think it’s important to think about whether you’re putting off decisions or conversations because they’re uncomfortable. You can be kind to yourself about the fact that you’re doing it, but trying to hide behind being busy with administrative tasks doesn’t serve you, your team, or your employer, so you have to find ways to do that work.

Leaving Digital Media for Tech
A bit over 3 years ago, I left a job in digital media for one at a tech company. A friend recently asked a bunch of us who made similar changes what we thought about leaving media. Since this seems to be something that people are doing with some frequency, I wrote down my thoughts in the hopes that they might help people who are evaluating a similar move.
Tiepolo: Inhabitants Leaving a Conquered City (Met Museum Collection)
A bit over 3 years ago, I left a job in digital media for one at a tech company. A friend recently asked a bunch of us who made similar changes what we thought about leaving media. Since this seems to be something that people are doing with some frequency, I wrote down my thoughts in the hopes that they might help people who are evaluating a similar move.
To be clear, I worked on the tech & data side: I wasn’t breaking stories or creating content (with very few exceptions). And news wasn’t my career, really: I worked at a tech company before my time in media as well. But working at the Gawker/Gizmodo/Fusion Media Group was formative for me, and I think of myself as a “media/news person”, to some extent.
With the disclaimer that everything from this point on is based on my (often idiosyncratic) personal experiences, here are the things that I miss about media:
The connection to The Discourse (TM): while I worked in media I felt energized by the reporting, and connected to what was being discussed. It definitely didn’t make me more productive, but I felt like I developed more sophisticated opinions about what was happening in the world, and the lens through which it was being communicated to me (both from publishers and peers). After leaving media, this feeling is noticeably dulled.
I miss the people from my old job on a bunch of different dimensions:
Media has diversity & representation issues, but tech is a whole other level of monoculture, and not just on racial/ethnic/gender grounds. My experience in media was one of companies aggressively looking to bring in people with diverse backgrounds (and sometimes viewpoints, though that’s maybe a whole other post).
I really miss the outspokenness and how people wore speaking truth to power as a badge of honor. I’m on the argumentative side of the spectrum, but public disagreements with people in positions of authority can really stress others that I work with. I was recently talking to a co-worker from an old tech job who remembered an argument I had with my boss literally 10 years ago (I didn’t remember it at all). In media, ‘afflicting the comfortable’ is a credo, and I doubt any of my coworkers from media will distinctly remember any of my arguments with managers a decade later (disclaimer: I’m told by my media friends this is very unique and not a global experience in the industry).
I don’t think I appreciated the passion people in journalism have for their craft. No one in America in 2021 is going into media because they think they’re going to get rich from it. People are news nerds, and they build relationships and friendships with their colleagues on this common set of interests. Don’t get me wrong, I have great friendships from past tech roles and my current gig, but the level of connection doesn’t feel the same.
Finally, I feel that the work of news organizations is truly very important, and being involved in writing the first draft of history, self-aggrandizing as that sounds, gave the hard work a real sense of meaning. I’ll say that I do feel energized by my current employer’s mission of helping people succeed online, on the open web, but I don’t feel the urgency or presence of that mission the way I did when Gizmodo broke a big scoop, for example.
On the other hand, there are a lot of things that I really appreciate about being in tech:
The flip side of being more distant from what’s happening in the world is that I feel more able to keep upsetting stories at an arm’s length. I have conflicted feelings about it, but I can’t deny that limiting my news intake has improved my mental health. In most cases I feel like this is a good thing: I can be informed and engage with the world around me without following every twist and turn of the Chauvin trial, to give a current example, and I think it would be hard to get away from if I was in media still.
The resources in tech are great, and are used in pursuit of technical objectives. In media organizations, we worked in support of a (great) mission, but building great tech wasn’t the organization’s mission in and of itself. It also was my experience that media companies often worked towards difficult or unrealistic timelines. This happens sometimes in tech as well (particularly in B2B companies, where work is often committed to clients) but it seemed to be far less prevalent to me.
I’ll also say that I appreciate the high level of technical ability and professionalism among my coworkers. That’s not a slag on the people I worked with in media: the technical capacity at GMG/FMG was very good, and many people at Squarespace came from media companies (and we are more than holding our own, IMHO, though we almost universally took reductions in title).
I am thrilled to be away from the calamitous ‘sky is falling’ feeling that infuses media companies. The industry’s dynamics are terrible! For all but a handful of sterling brands or companies with generous benefactors, it’s a race to the bottom. The industry has been ‘commodified by its complement’ almost completely, and with the aggregation of media consumers by tech platforms, the theory behind the existence of digital media firms (a la Coase’s famous ‘The Nature of the Firm’) becomes somewhat dubious.
This last one is almost certainly the most idiosyncratic and specific to me, but ethically, I had a difficult time working as a data professional in media. There was always some pressure to figure out ways we could make money from our data, and most of the obvious ways were not in the best interests of our readers (enlightened managers understood this and invested deeply in these reader relationships). You might be surprised that I feel better about the ethics of my work at a tech company, but in my specific role, I definitely do. Your mileage may vary on this one, though.
Thanks to Jenni Bruno, Tyler Alicea, Josh Holbrook and Allison Wentz for their helpful comments.
Do You Want to Know Why I’m Missing Work?
A few weeks ago, a colleague took time away from work for a personal issue. This person (let’s call them Sam) told their manager, who mentioned it to me (the manager’s manager). This was (and is) all fine, and happens all the time.
The next week, I had my regular meeting with Sam, who asked me whether I wanted to know what was going on that caused them to miss work.
I gave Sam a quick answer (something about not wanting to pry), and the conversation moved on, but privately I’ve been struggling with my answer to this question for well over a week.
The idea of ‘bringing your whole self to work’ has been ubiquitous and cliché enough to inspire snark for a while now, but the importance of empathy, humanity, and creating safe spaces is something that I really buy into. Still, as a manager sometimes the ‘right’ thing to do in this regard can be terribly difficult to figure out.
In general, I would invite anyone on my team to share as much about themselves as they feel comfortable sharing. And maybe that’s the right way to create the environment that I want to create. Maybe Sam wants to talk about it. Maybe they feel constrained by a vision of professionalism, and don’t want to be the first to broach personal topics of a certain sensitivity.
On the other hand, I’ve seen managers push employees to share more about their personal situations than the employees feel comfortable with. And Sam’s hesitancy might not be signaling a desire to talk about what’s going on; it might signal a feeling of obligation. Does Sam feel obligated to justify being out of the office? Or do they think they need to model extroversion and candidness with me (a notoriously candid extrovert) in order to advance in their career? I don’t know. The space of potential motivations is vast.
The idea of not wanting to share a piece of one’s life with work also resonates with me. A long time ago, I had to miss work for a personal issue that I very much didn’t want to talk about with my coworkers. That company was not a ‘bring your whole self to work’ kind of company, which I appreciated in this specific instance.
So what should I do next time? What’s the action item coming out of this retro? I think writing this post, in and of itself, is one.
The other is to ask more questions. My gut reaction to ‘Do you want to know why I’m missing work?’ is really ‘do you want me to know?’ but that isn’t the right framing, really. After some thought, it’s closer to ‘Would you prefer to talk about it with me, or would it help you more not to talk about it with me?’
This, I think, is what I’ll ask next time.
5 Years of Newslettering
January 19th, 2021, will make 5 years of sending my NYC Data Jobs Newsletter.
Sending out a newsletter has been one of the most rewarding things I’ve done over the last few years. In the hopes that talking about my experience would be helpful to people who are either just starting out, or are thinking about it (and, selfishly, encourage people to write more good newsletters that I can read), I’ve written down a few observations and experiences, 5 years in.
January 19th, 2021, will make 5 years of sending my NYC Data Jobs Newsletter.

January 2016. A simpler, better time
Sending out a newsletter has been one of the most rewarding things I’ve done over the last few years. In the hopes that talking about my experience would be helpful to people who are either just starting out, or are thinking about it (and, selfishly, encourage people to write more good newsletters that I can read), I’ve written down a few observations and experiences, 5 years in.
Why I Started
Apparently right now, ‘Newsletters are having a moment’. I’d love to claim credit for being ahead of the curve on this one, but those pieces were coming out in 2019, 2017, and 2015 as well. I can tell you that it didn’t feel ahead of the curve to start emailing people in 2016.
The newsletter grew out of teaching. I was one of the earlier lecturers at CUNY’s Master’s in Data Analytics (MSDA, later renamed MSDS, here are my students’ final projects, which I love and have proven surprisingly durable).
The students in the CUNY program had diverse experiences, the first class especially: some were just out of undergrad programs, and some were older professionals looking to make a career change, but the backgrounds were all over the place. One told me he had been stuck at Rikers Island for weeks before starting class, and another was a retail clerk, trying to break in to a more analytical role.
I loved the teaching and the students, but I was frustrated with the career placement support from the university, which they were trying to build basically from scratch.
At the same time, the job market for Data Scientists in 2014 and 2015 was wildly different from today (before the junior talent bubble). In NYC, tech companies were still paying much less than quantitative finance jobs and the sector was doubling every 3-4 years.
I was getting weekly inquiries from industry friends, looking for junior hires, and I was able to connect a few of them, but I couldn’t keep track of who was looking for a job and who would be a fit for which job. After a year of struggling through this situation, I decided just to offer everyone access to everything. I sent this email to all my students over the previous few semesters and about 25 people I knew in the industry:

19 people signed up for my first email.
By the 5th email, I was including links to events, though I didn’t make that permanent until July: if memory serves, the main reason I started was that I had missed PyData NYC in May and I couldn’t find a comprehensive list of data events in the area, so I extended the newsletter’s mandate to include events. I started including local posts a month later, since I’d written something, as had my friend Dan.
Since then, I’ve made a few minor changes, but the newsletter hasn’t changed much at all.
Pretty early on, people were telling me that they were finding jobs and candidates. Two of my students found jobs through the letter, including the one who had been at Rikers, and I felt a real rush. I was hooked.
Some Numbers
The questions I get asked most about the newsletter are ‘How much do you charge people to be included?’ ($0, though ODSC East offered to give me a pass this year before they went remote) and ‘How many subscribers do you have?’ (at the moment, 1,318). Given the topic of the email, obviously I have a bunch of other numbers that I track, mostly thanks to the undocumented tinyletter API & Jeremy Singer-Vine’s nifty library.
Starting off with some good old-fashioned vanity metrics:
207 emails written
122,723 emails sent (that's sum(email x list size))
71,483 unique opens (58%)
152,076 link clicks (2.1 link clicks per open)
175 lifetime unsubscribes (~ 0.84/letter)
The number of people signing up for the newsletter has grown in fits & starts, but has been more or less linear over time. I’ve spoken to a few other people about their letters (Jeremy makes all his data public) and unless you’re actively investing in growing a newsletter, I think this is a pretty common experience.

Open Rates for the letter had actually been more stable than you might expect: after an initial ‘burn-off’, open rates were basically stable for 2 years, from mid-2018 until earlier this year.
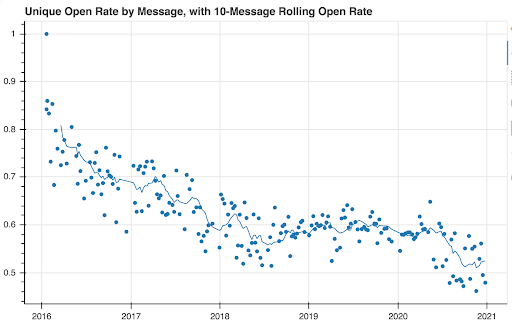
There actually has been a pretty large drop-off in late May / early June, where open rates fell pretty meaningfully. This has been something of a mystery to me. I’ve been able to rule out a few potential causes (getting caught in spam/filters, less interested new subscribers) but I still have a few suspects:
More competition: there are lots of data newsletters out there, (newsletters are having a moment, haven’t you heard?) I know I can’t keep up with everything that’s going on out there. It stands to reason that the newsletter would probably fall off peoples’ reading lists.
There’s some evidence for this: Data is Plural had a similar dip, though less pronounced. It also ‘makes sense’. However, I don’t think that explains the sudden-ness of the drop.
Less Value: it’s possible the newsletter became less valuable to people, through several different potential avenues.
One, there are no longer in-person events. Anecdotally, many people have told me that they find the event listings to be the most valuable part of the newsletter. This makes sense to me, but the timing doesn’t match up great: I stopped posting in-person events months before the open rate dropped,
Two, there’s the possibility that having a newsletter about NYC is less valuable to people because many of them are moving out of NYC. This is the most depressing possibility, in my mind.
Lastly, I can’t rule out that the difference has been me, and changes in the letter’s quality & focus. The dropoff happened right after the murder of George Floyd, and in the months after I made more references to legal & ethical considerations than before (though I certainly had made them before) and I can’t rule out that it may have pushed readers away.
It’s also possible that there’s been a drop in quality broadly, because of (gesturing vaguely at 2020) life. This was a tough year for lots of people, and though I’m certainly very fortunate, I can say that I’m no exception. I don’t think I did the best I could have, every single week.
That got a little heavy. Let’s look at the top links!
By raw clicks :
IBM will offer free COBOL training to address overloaded unemployment systems I totally forgot about the long waits to sign up for unemployment checks in March and April, and that systems were buckling under the load.
Our remote work future is going to suck More feel good stuff! In fairness, this is probably here mostly bc I messed up the link
A job posting for the ACLU Now we’re talkin’.
Working for the Vera Institute of Justice
Data Scientists Should Be More End-to-End a great piece by Eugene Yan
If I look at links by open rate, it’s mostly the same, though I’d also include this great post on Engineering Career Development at Etsy and my offhand link to Jewish Mysticism (my next newsletter? Who knows?!)
I also spent some time looking at what types of entities in the subject line lead to a greater open rate. I haven’t come to great conclusions despite a fair bit of work on it. It appears that subject lines that highlight legal, ethical, & privacy considerations do well, while those linking to insurance or finance jobs do poorly, which makes sense. It also seems like having subject lines that are a little off-topic don’t wildly impact open rates, but they do lead to more people unsubscribing. I’m still playing around with the data.
Observations & Advice
So that’s enough about my newsletter! What advice do I have for potential future newsletterers?
Do something you think is fun and important: This is very obvious advice. But it’s easy to focus on the numbers behind a newsletter, and there’s obvious value in ‘being big’. But in general most newsletters won’t make it onto a leaderboard or a ‘10-best’ list. Doing something that you enjoy and get meaning out of is critical to get you through the inevitable highs and lows.
To put maybe a finer point on it: writing regularly is a lot of work, no matter what. I have set up my newsletter to be the absolute least amount of work I can possibly make it, and some weeks I still find it to be too much. Some weeks no one responds and I feel like I’m just shouting into a void (that happens less now, with more subscribers). At Gawker, I could see the abandonment rates of Kinja blogs, and the numbers are staggering: 1-year survival rates were under 25%, even for the core audience.
Find a rhythm that works for you, don’t sweat deadlines: I know every audience is different, but for my audience, the timing of the email makes very little difference. Yes, email performs better on some days than others, but the effect is very small (except Fridays & weekends). I’ve played around with sending the letter at different days, and different times of day, and at different cadences, and the effects aren’t large. If I had to guess a ‘best time’, I’d say early evening letters have the highest engagement rates, but you’ll probably notice that I usually don’t send letters at that time because it doesn’t really work for my life.

I suspect the drop-off in clicks on weekend emails is due to more people opening on mobile devices, but I don’t have that data ¯\_(ツ)_/¯
Value the relationships: I read somewhere (I can’t find the source now) that the value of a lot of writing is not necessarily in the volume of people who read your work, but in the number and quality of conversations that it spurs. This has definitely been the case for me.
Email is different from social media in that emails are personal correspondences with a real expectation of privacy. The inbox is a safer, more private space (that unfortunately says more about social media than email). Email newsletters have a lot more friction and won’t ever achieve the broad visibility of a great tweet, but I’ve built many more important relationships via my 5 years with a newsletter than my 11 years on Twitter (despite spending much more time on the latter).
Closing Thoughts
One question I don’t get asked much, but I wish I did, was ‘How many people have found jobs through your letter?’
I don’t know the answer to that, exactly, but it’s in the dozens. It may be 100 at this point, though I doubt it. I know we’ve hired at least 3 people onto the Squarespace data team primarily because of the newsletter in less than 3 years, so in that regard it’s been a great success (want to be #4?).
I have a few thank-you notes that I’ve gotten from people who have found jobs & consulting gigs, or who have hired someone, through the newsletter. Those are gold. I find myself occasionally looking at them when I don’t feel like putting the letter together.
So, thank you to everyone who has sent me a note like that. And thank you to all of you who have sent me a posting, or an article, or an event to include in the newsletter. I literally couldn’t do this without you all. And to any subscribers, if you have ideas on how to make the letter better, please let me know, either on twitter or just reply to one of my emails.
Here’s to another 5 years!
(Thanks to Jeremy Singer-Vine for his comments on a draft of this post!)
Moving to Squarespace
This week I started a new role as the Director of Analytics at Squarespace. I'm really excited about the role and the team that I'm going to be working with!
Not only have I moved, but this blog has moved too: you might notice the 'powered by Squarespace' box at the bottom! I'm happy to say that the migration was relatively smooth. This is now the 3rd CMS that this blog has been hosted on.
A few links & images from the old tumblr days are now gone: I think this is more a function of link rot than anything else, but I did lose a few images for mysterious reasons. I also have to keep the blog off of SSL until I migrate the last few images. But generally I was pretty happy with the process.
I'm going to miss my friends at Fusion Media so much. They gave me the sweetest sendoff imaginable, and I'll remember my years there very, very fondly.
But the role here at Squarespace was too good to pass up. I'm passionate about the open web, and I'm so excited to help support millions of people and businesses participate in something that's so important to me. Being able to do this for a company based here in NYC is amazing, and I'm wildly excited to be digging into the role already!

When to Avoid the Subway - PyGotham 2017 Talk
My name is Josh Laurito, and I'm here to talk to you about the intersection of three of my favorite things: python, New York City, and trains.

My name is Josh Laurito, and I'm here to talk to you about the intersection of three of my favorite things: python, New York City, and trains.

A couple of quick things before we get started:
One is that this talk is a little more Gotham than Py. I’ll be talking a bit about the tech I used here, but if you’re looking for something that will help you once you actually get to work, you might be happier in one of the other talks.
The code and data for this talk are available on Github if you’re curious.
The full text and slides of this talk are available at my website, blog.joshlaurito.com, so if you want to follow along there or catch up because you were distracted by twitter & missed one of my pearls of wisdom, you can do that. I also have posted a link to this talk on my account: @joshlaurito.
Also, a quick plug: I have a weekly email about the data & analytics community in New York City, highlighting events, jobs, and some of the great posts that are written by members of our community. You can check out the archive at tinyletter.com/nycdatajobs, and if you find it to be interesting, you should sign up.
Ok, on to the talk.

The NYC Subway
Most of us who live in the city take the subway everyday, and the decay of the subway has become part of our normal routine. But for those of you from out of town, let me give you a quick introduction to the system.
The NYC subway first opened in 1904 with 28 stations. This is a picture of the construction of one of the original stations, Columbus Circle, about 4 years before opening.

Today, the system contains 422 stations (as we commonly think of them, the MTA counts more), spread across about 23 lines (depending on whether you include the Staten Island rail and if you differentiate between the multiple ‘shuttles’ or S lines, and if you differentiate between the J & Z lines, which are now the effectively same train).
The system includes about 6,400 subway cars, making over 8,000 trips per day, totalling about 1 million miles per day. With the opening of the Second Avenue Subway this January, there are more than 665 miles of track.
5.7 million people take the subway on an average weekday: in 2016, 1.76B rides were taken.

The map you see inside of the subway stations is actually a very accurate display of the system: other than a general widening out of manhattan, trains move in the direction you see on the map. In general, lines that go North-South are longer than the lines that go East-West. The longest line is the A train, which makes 66 stop along over 32 miles of track.
The Problem

Unfortunately, the subway has been getting worse over the last few years, by almost any definition or metric you’d want to use. The MTA, to their credit, posts a number of different stats online in order to be publicly accountable for what’s happening.
Here is a graph of the On-Time Performance of the lines over the last eight years. A train is considered late if it makes it to the end of its route more than 5 minutes after the anticipated time, or if it skipped a stop. That’s admittedly a pretty strict standard, but the performance is abysmal. The main IRT lines (those are the numbered lines) have on-time performance as low as about 30%. By the way: this chart and all the charts in this presentation were produced using Bokeh. This is my first project using Bokeh, and I’m blown away by it: would highly recommend.
While the MTA, which operates the subways, as well as local buses, commuter rail, and bridge and tunnel operations, should be lauded for making this information available, it doesn’t actually provide us with a lot of guidance around what we can do to make our commutes better, or to make sure we’re on time for things. But the MTA does provide a lot of information that’s updated in real-time or near-real-time: they have a very well laid out developer page with a list of resources, and so potentially we can use it to make better decisions about when we can expect the subway to be working, and when we should leave extra time.
One of the data sources is an XML endpoint that updates with major service change status, updated every minute. This is great for up-to-the minute status checks, but there’s no history stored in an accessible location.

Another source is the GTFS feed. GTFS, which stands for General Transit Feed Specification, is Google’s standard for ingesting transit data.
The feed itself is somewhat difficult to work with, since it requires data to be sent as a Protocol Buffer. Let me take a quick minute to talk about these.

Protocol buffers are a standard for serializing data. They originated as google’s internal standard for storing and transmitting data. They’re most similar to XML in that the data they encode is inside of a highly specified, tree-like structure, but they’re much smaller since they aren’t encoded as text, so they’re appropriate for highly-concurrent applications.

Unfortunately, they are not human-readable and are not at all well suited for doing exploratory data analysis. Fortunately, since Google treats python as the first-class language that it is, the python protobuf library is part of the core protobuf project, so support is extremely good. If you’re considering working with the GTFS feed, I’d strongly consider that you convert all the data to JSON before attempting to work on it.

However, if you do manage to get to the GTFS feed, there are a few issues. The primary one is that there isn’t a lot of historical data: the city started saving this information and kept it up for several months in 2014, but discontinued the project. And you’ll need to find the city’s .proto spec if you’re going to decode the information. It’s available, but difficult to find: I’ve posted a link in the github project for my research.

The city’s implementation of GTFS is kinda wonky. Here’s an excerpt, converted to JSON. Not every train is identified every trip, and stalled trains don’t send any signal, making it very hard to identify when there’s an issue. You might notice if you squint that arrivals and departures are listed with the same time. Also, if we’re hoping to do long-term historical research, the data just isn’t there. One committed civic hacker had a system up to pull in the data, but only ran the server for a bit over a year before stopping. I’ve been pulling in this data every 10 minutes or so, but I don’t want to wait years to be able to start the analysis.

Which brings me to the My MTA Alerting System.
In late 2008, the MTA announced a program to send emails & text messages to subscribers about unplanned service disruptions. This program has been reasonably popular and has been maintained for almost a decade. So as a result, there is a record of every major service disruption on the Subway, the bus system, the LIRR, MNR, and bridges and tunnels.

The great thing about this system is the volume of the data that’s in there. over the last 9 years, the MTA has sent over 450,000 alerts, which are crawlable! Over 100,000 are related to the subways: slightly more are related to buses and the LIRR, which from what I can tell are less reliable systems.

Just to prove it worked, the MTA sent a signed message announcing the creation of the program. This shows the structure of the alerts: they have a title, a message body, a timestamp and a system reference, which tells us which system it’s referring to. All of these have been stored online and are accessible.

Going through the alerts when you aren’t trying to go anywhere is actually a lot of fun. As someone who’s lived here for a long time, lots of things that I’ve lived through and seen are encoded here. Most long time New Yorkers will recognize this alert as relating to the night when all the Thanksgiving Parade balloons get blown up, which most long time New Yorkers will also tell you is the one of the best things to see in New York.

Also, like you’d expect from such a large corpus, you’ll see all sorts of weird and non-intuitive messages. This one is one of my favorites. I initially thought this was referring to some lesser known catholic feast, but I can’t find any reference to that, so I have no idea what was happening.

Probably my favorite thing about the alerts, though, is that inexplicably the Bridge & Tunnel alerts are always in all caps. Which is just perfect.
Anyways, so, on to the Python part of this. I built a simple web-scraper to pull all of these alerts down, with an initial pull going about 3 years back: I engineered a number of features, primarily to help me extract which lines are impacted by each alert, and whether the alert was new or an update, whether it was letting people know about a planned change or an unplanned emergency or a non-service change, like the elevators being broken.
After cleaning the data, we want to do a quick sanity check on whether the data we have is any good. So I looked at the relationship between these alerts and the ground truth over the last 3 years: MTA’s on-time performance. So this a chart of on-time performance vs. the number of disruptions. Number of disruptions is on the x axis, and the on-time performance is on the y axis. The number on the charge is the coefficient of correlation, or R-squared.
Fortunately, the relationship between these variables is extremely strong! Across the 20 lines that have been under continuous operation, the average correlation between the number of alerts and on-time performance is about -0.5, and all trains but one have the expected relationship of more disruptions = more delays.

The two major exceptions to this trend were the R & 6 trains, which required some investigation. The R train underwent 2 major changes to service over the 3-year time-period. Before fall 2014, the R had operated in two distinct sections for over a year as repairs were made on the Montague tunnel. Then, late last year, late-night R service was extended to Whitehall street, which allowed the R to avoid some problem spots in queens. You can pretty clearly see the impacts of the service changes on the R.

I don’t have as clear of an explanation about the 6 train, and why it’s an outlier. I believe this is due to the 2nd avenue subway line opening early this year, which was primarily designed to take pressure off the 6. So while the rest of the system has gotten worse this year, the 6 is slightly better. As a regular rider of the 6 train, that seems like a reasonable explanation. An alternate hypothesis would be that *no matter what happens in the system, the 6 will probably be late*, which I have to admit is also a pretty compelling theory.

Looking at system-wide disruption also gives us a nice way to measure the system performance on a day-by-day basis. Here’s a graph of day-by-day performance in terms of the average number of disruptions, along with the 28-day moving average. You can see some spikes in the winter, which after investigation, I can tell you are due to snowstorms.

At this point, we need to do some more classification. I engineered some additional features to try to get at the cause of each alert. Fortunately, Scikit comes with a ton of classification tools: I used a decision tree on top of some heavily engineered features, and then I manually classified a little bit over 1,000 alerts to train the model, and then validated on an out-of-sample selection, which was classified with 96.9% accuracy.

So now we can look at the performance of the subway over the last 36 months, with the impact of bad weather pulled out. Like before, this is the daily number of disruptions, with the 28 day moving average in bold. We can see pretty clearly that the system has been dealing with more disruptions, jumping from an average of about 15/day over the last few years, to about 22 since late last year. That’s roughly a 50% increase in disruptions. We aren’t just imagining things, the trains really are worse.

So now that we’ve identified weather as driver of performance, we can look at how precipitation impacts the trains. I pulled daily weather information from NOAA and regressed it against performance. The relationship is rough linear, and every inch of precipitation results in about 5 additional disruptions per day, or the first inch of rain leads to about a 30% increase in disruptions compared to a dry day. The relationship isn’t incredibly strong though.

There’s a much stronger relationship when we look at snow: here we see that each inch of snow leads to about a 10% increase in disruptions compared to a dry day. I also took quick looks at cold and hot weather: there’s a slight association between cold weather and delays, nothing meaningful for hot weather, though.

So one cool thing that also comes out of this is this is that we can now see a breakdown of all the causes of delays on the subway to a fairly high level of accuracy. So here’s my obligatory jupyter notebook screenshot/reference. Excluding some delay types we don’t care about, like non service announcements, on an average day, over the last three years, the system sees about 18 disruptions per day. The most common causes of delays are general equipment problems and signal and switch problems. Sick customers, police activity, and maintenance make up the other very common disruptions.
If you’re reading closely, you’ll notice that I’m breaking out ‘end of disruption’ alerts separately: occasionally the city will only announce a disruption after it has passed, which I am classifying slightly differently.

Anyways, another nifty thing we can see here is a relative ranking of how bad each disruption is, estimated by the number of alerts & updates that get sent for each one. The MTA sends updates roughly every two hours for ongoing disruptions, so as a very loose rule of thumb, I think of every update as representing an issue open for two additional hours. You can see that ‘construction’ is far and away the worst, which might be confusing, but what I mean here is road construction impacting shuttle buses. So these are situations when you’ve already transferred to the bus, and then the bus is rerouted by construction, as you can see in some selected messages on the right.
Unplanned service changes, weather disruption, and accidents (which usually mean someone hit by a train) take a long time to resolve. Sick customers don’t take too long to get off the system though.

So finally we’re really in a place to think about when to avoid the subway. The first thing I looked at is when the most disruptions occur. Here’s a heatmap: darker colors mean more disruptions. Turns out that the worst time for the system is Monday morning, between 8 & 9AM. On weekdays, disruptions primarily happen between 6 & 10 AM, and between 3 & 7PM in the afternoons. Fridays are by far the easiest day of the week.

Putting this data another way, on Monday mornings, there is an 80% chance that there will be a disruption somewhere in the system in any given hour. That falls to about 20% by the middle of the night.

Pretty clearly, there is a direct correlation between the number of people on the system and the number of disruptions. This makes sense for a lot of disruption types, like sick passengers and overcrowding, but also applies to things you wouldn’t expect. Here’s the chart for equipment problems by hour: you’ll see that though we wouldn’t necessarily expect equipment to always break down during rush hour, our disruption announcements do. This gives me some level of concern about the quality of the dataset, though if we’re missing slight disruptions that happen late at night I think I can live with that. I mean, if a train stalls in the middle of the night and no one is on it, does it really create a delay?

Unfortunately, since most of the disruptions follow a very similar pattern of being worse early in the week and in the morning, there isn’t really much to say about the relatively likelihoods of each of the delays. There are two exceptions though:
Maintenance windows clearly happen off-hours. Even when the MTA needs to do unplanned work, they obviously strive to avoid working during peak hours.

The other main exception is with sick customers. It’s a little hard to see, but sick customer delays become more common later in the week, with Thursday and Friday afternoons being slightly heavier than earlier in the week. On Fridays, every hour from 1PM to 7PM, there’s about a 20% chance that there’s a sick passenger causing a delay on the system somewhere. I’ll leave it as an exercise to the audience to figure out why.

We can even go a little deeper and see which disruptions are likely to happen on each line. Here’s a heatmap of disruptions by line for the major causes of delays. While again we see the same pattern in the data, there are some identifiable differences. Delays on the L are dominated by equipment problems, and the very similar 7 train deals with the same. My 4/5/6 deals with sick passengers the most, maybe because it serves the Bros of Murray Hill (which I say with love, having been one). The F train in particular suffers from signal & switch problems, while the J/Z, G and 1 trains seem to be pretty reliable day-to-day.

Probably the most interesting thing I’ve found so far, though, and what I’m continuing to research, is how delays cascade throughout the system, from one train line to another. Obviously trains that run on the same line will share a lot of delays: if there’s a problem with the 4, it will usually impact the 6 in some way. However, in the outer Boros, there are a lot of trains that run together differently than they do in Manhattan. As a result, from a Manhattanite’s perspective, there is some ability to predict issues on what seem like unrelated lines. The E & F, for instance, don’t run together at all in Manhattan, but they do share a line in Brooklyn. Fairly often, when there’s an issue with one of them, the other will reflect this and will be disrupted not long after, and this does have some predictive power.

Unfortunately, that’s about as far as my research has taken me, as of now. I continue to look at different ways to model expectations of delays, but currently I haven’t been able to do better than about 30% accuracy, as measured by correctly predicting which line will have an incident in a given hour. It is the final irony of my work on the subway that I’ve spent hours on it, going nowhere or slower than I hoped.

Still I promised to give you some advice that you can use to make your commutes slightly better. And I do have the data to give a few simple pieces of advice. If you’re going to choose a day to stay home bc you can’t stand the commute, always choose Monday. If there’s an unplanned service change, stay away from the line for the rest of the day, but stick around if there’s a sick passenger or police activity: those resolve quickly. If you can stay home when there’s more than about 2 inches of rain or 5 inches of snow forecast for the day, you probably should.

And definitely sign up for alerts: if you can’t know about delays ahead of time, at least you can know about them in real time.
Thanks a bunch for listening, and safe travels.
Moving to Gawker Media
 I'm super, super excited to post that I just completed my first full week at Gawker Media. I'll be acting as Head of Data & Analytics for the company, primarily helping to improve their kinja platform but also supporting the editorial team at their media properties.
Any work-related findings or posts will be at the (brand new) Gawker Data Team blog: gawkerdata.kinja.com.